Parks & open spaces and user sentiment: A case study of San Francisco using Twitter data
Parks and open spaces (referred to as parks below) in cities are believed to have benefits on well-being of city residents. This exploratory project uses real-time streaming twitter data to correlate quantified sentiment inside/outside parks in San Francisco. It tries to answer the question: are people more positive when they are in parks compared to when they are not? Specifically, are people expressing more positively through Twitter when they are visiting parks? The result of this preliminary study provides some evidence to a possible “yes” to the question.
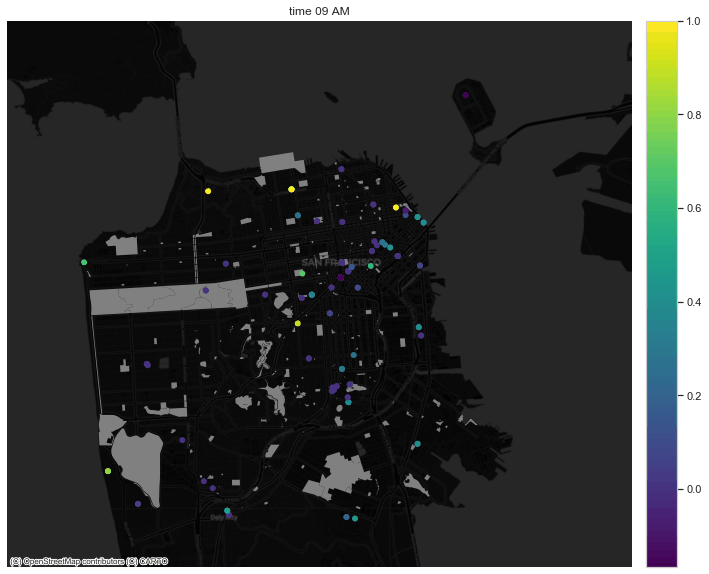
As a trailer of this analysis, below the GIF shows in-park tweet sentiment by time of day on a weekend in San Francisco:
Data Collection
Tweets
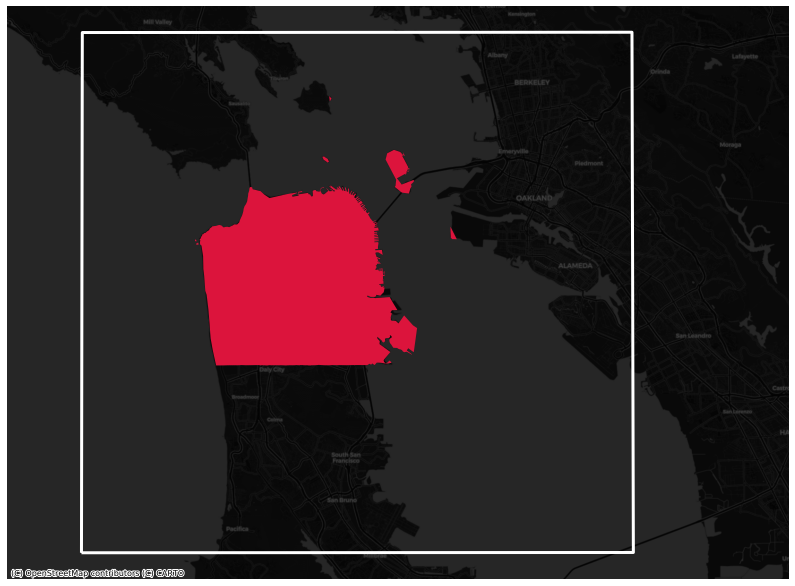
I collected geo-located tweets by real-time streaming, and added a filtering condition of a coordinate bounding box as a proxy to San Francisco boundary. I streamed tweets from 9am to 6pm Pacific Time on Dec. 14th (Sat.) and Dec. 15th (Sun.) and collected in total 30886 tweets with geographical location. For every tweet, I extracted information of user id, user location, text (extended tweet if available), latitude, longitude, place type, posting time.
To better obtain an understanding of the relation between parks and local resident well-being, I focused on local residents instead of tourists who could tend to express more positive sentiment on their vacation. After filtering by a tighter bound for the city, a strict 9am-6pm time window, and local user location (San Francisco or CA), I had 6833 tweets for analysis. Then I cleaned up the texts by removing URLs, @users, and hashtags. Finally, I tokenized the tweets and removed punctuations and stop words for later analysis.
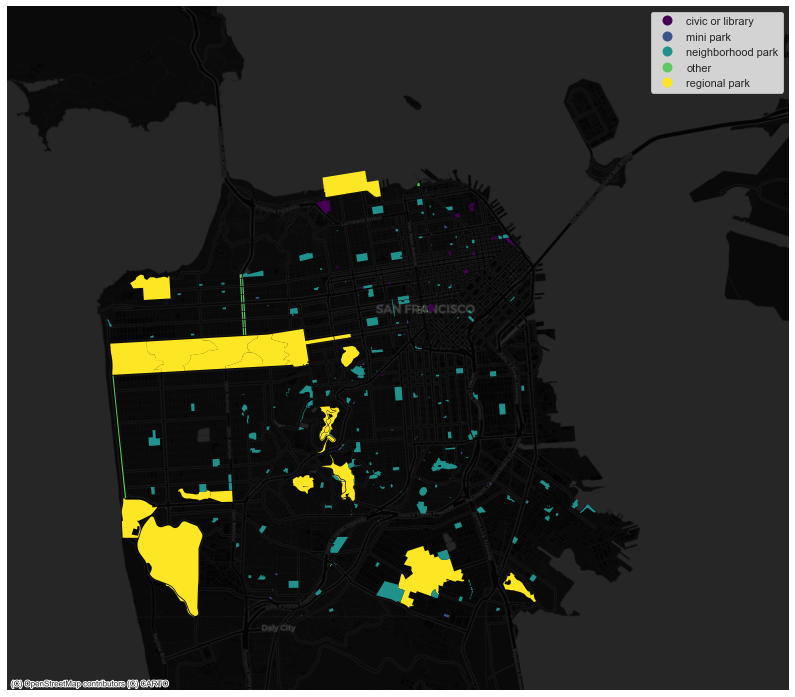
Parks
I obtained the park geometry, park score, and city boundary data from the open data portal DataSF. I aggregated the park type to 4 categories: neighborhood park, regional park, civic or library, mini park.
Exploratory analysis
Classify in-park and outside-park tweets
Where do people tweet:
I classified “in-park” tweets by spatially joining park information to the tweets . In this way, 234 tweets were classified as “in-park”.
Twitter text EDA
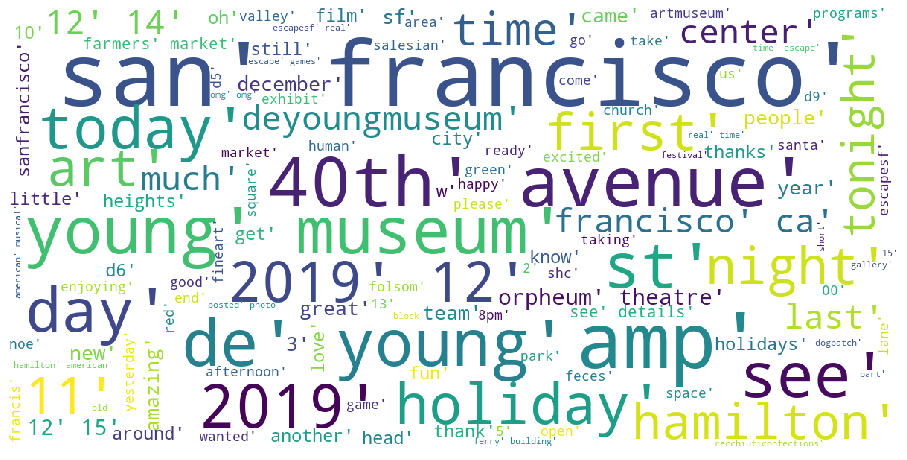 Word cloud of in-park tweets
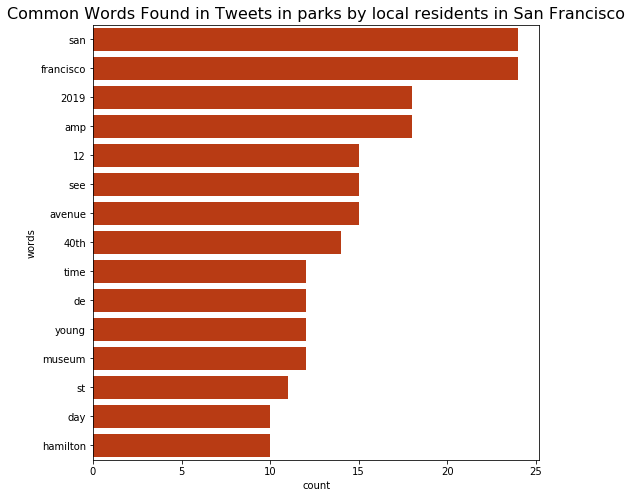
Tweets inside parks are found to be longer than tweets outside parks, which is statistically significant at level of 0.05. On average, an in-park tweet has 10.4 words, while an outside-park tweet has 8.8 words. Moreover, word frequency analysis shows that residents are mostly tweeting “San Francisco” and “CA” in parks. Other frequent words include “avenue”, “see”, “2019”,and etc.
Most frequent words in in-park tweets:
Sentiment analysis
Positive and negative word count
The counts of positive and negative words of each tweet echo its sentiment. I used Hu and Liu opinion lexicon (English) positive and negative word corpus and conducted the counts.
Histogram of positive word count inside and outside parks:
Histogram of negative word count inside and outside parks:
Polarity and subjectivity scores
I used pre-trained model of package “textblob” to calculate the polarity (range: -1~1) and subjectivity (range: 0-1) of the tweets.
Histogram of polarity inside and outside parks:
Histogram of subjectivity inside and outside parks:
Polarity of tweets:
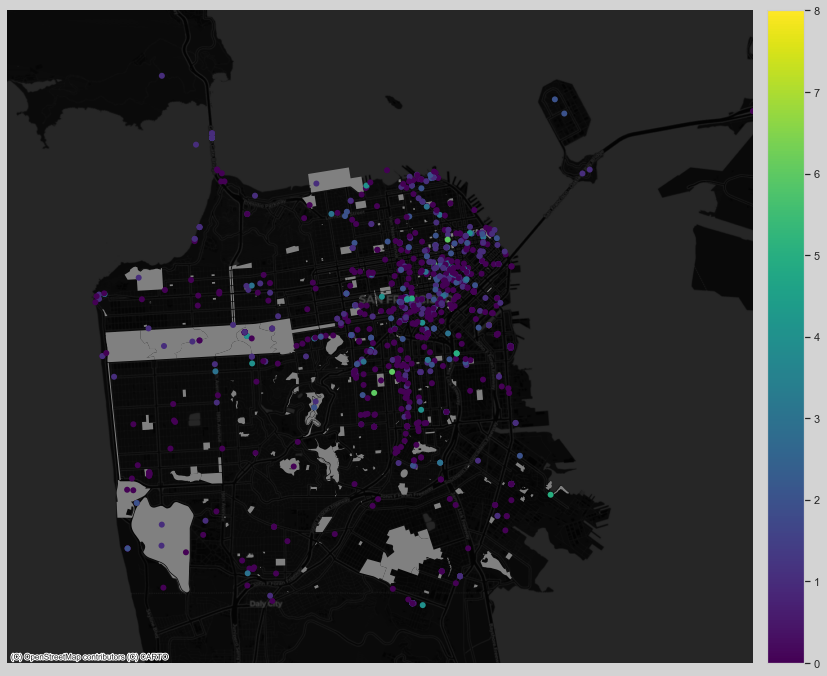
Heatmap of negative(polarity<0) tweets :
Heatmap of top 50% positive(polarity>0) tweets:
Testing in-park and outside-park difference
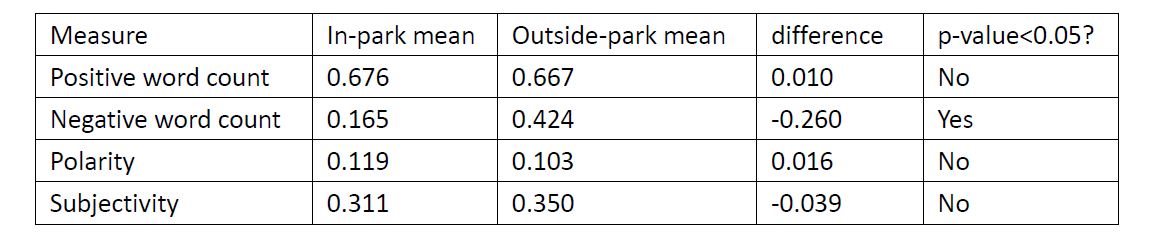
T-test: on average, a tweet in parks has 0.26 less negative words than one outside parks, this difference is statistically significant and level of 0.05.
It’s worth noting that this pattern persists despite that in-park tweets are 1.6 words longer than outside-park tweets on average. Therefore, people particularly tweet less negative words in parks.
Table: t-test result
Testing park type difference
There are four aggregated park types: neighborhood park, mini park, civic or library, and regional park. I tested the sentiment statistics against the types using ANOVA, but hardly found difference at the level of 0.05.
Time variance of sentiment
A roughly fluctuant pattern shows up that in-park tweets posted in early morning, early afternoon, and at dusk are more positive. This pattern is consistent with that of tweets outside parks. The pattern of subjectivity is less clear.
Polarity of tweets inside and outside parks from 9am to 6pm
Subjectivity of tweets inside and outside parks from 9am to 6pm
Summary and discussions
Major findings:
- In park, people tend to
- post longer tweets;
- post fewer negative words although they post longer tweets.
Findings of “no-finding”:
- Consistent sentiment difference among different types of park is not found.
- Substantial sentiment variation across time of day is not found.
- Correlation between park score and sentiment is not found.
To dive deeper into the question I raised at the beginning “are people more positive when they are in parks compared to when they are not?”, more extensive data is certainly needed. Higher volume of tweets should be collected across different days of week and different months of year. Moreover, given this is only a preliminary attempt, theoretical review of the use of tweets as indicator of spatiotemporal public expressed sentiment is also required for more solid analysis.
Thanks for reading :) Feel free to leave me comments on my Github page https://github.com/HeZHANG0 .
Reference
Hu, Minqing, and Bing Liu. “Mining and summarizing customer reviews.” Proceedings of the tenth ACM SIGKDD international conference on Knowledge discovery and data mining. ACM, 2004.
Schwartz, Aaron J., et al. “Visitors to urban greenspace have higher sentiment and lower negativity on Twitter.” People and Nature (2019).
Plunz, Richard A., et al. “Twitter sentiment in New York City parks as measure of well-being.” Landscape and Urban Planning 189 (2019): 235-246.
Lim, Kwan Hui, et al. “The grass is greener on the other side: Understanding the effects of green spaces on Twitter user sentiments.” Companion Proceedings of the The Web Conference 2018. International World Wide Web Conferences Steering Committee, 2018.