Twitter hateful user identification using deep learning graph models
Overview
Detecting hateful users protect the online social environment from contamination. This project builds models from the Twitter user and network dataset to predict whether a user is hateful or not. The data consists of user information, user’s tweet information, user’s network information and the complete network graph. I first explored the data, and found out that hateful users are usually more active, more powerful in the social network, and tweets more negative words. Then I built a logistic regression model using manually engineered features of user, tweet, and nerwork information. The second attempt was to directly learn a predictive model from the user’s tweet embedding (GloVe embedding in this data). Lastly, I built Graph Convolutional Network models using both user features and the network graph, and compared GraphSAGE, GCN, and GAT models. It turns out that the logistic regression model and GraphSAGE have the most satisfying overall performance. However, GraphSAGE is much better at recalling hateful users, although at the expense of mistaking normal users for hateful ones. For imbalanced data, recall could be more important than precision. Another advantage of a graph model is that it can effectively be trained on a much smaller portion of the data to achieve satisfying performance. The graph embedding is also shown to differentiate hateful users from normal users via a TSNE analysis.
Data
This project uses the data publicly available on Kaggel: https://www.kaggle.com/manoelribeiro/hateful-users-on-twitter#users_neighborhood_anon.csv
Methods
I combined different methods and data to build predictive models: 1) Logistic regression on user, tweet, and network information; 2) simple neural network on tweet embedding; 3) Graph Convolutional Networks on user and tweet information together with the complete network graph.
Exploratory Data Analysis: What Are Hateful Users Like?
Below I compared the user, tweet, and network features across different categories of users: hateful vs. normal users; neighbor of hateful users vs. non-neighbor of hateful users; suspended users vs. non-suspended users.
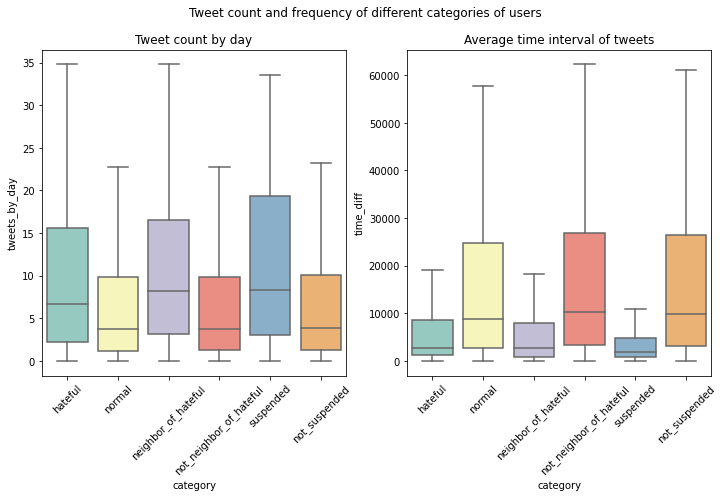
On average, the hateful users are more active:
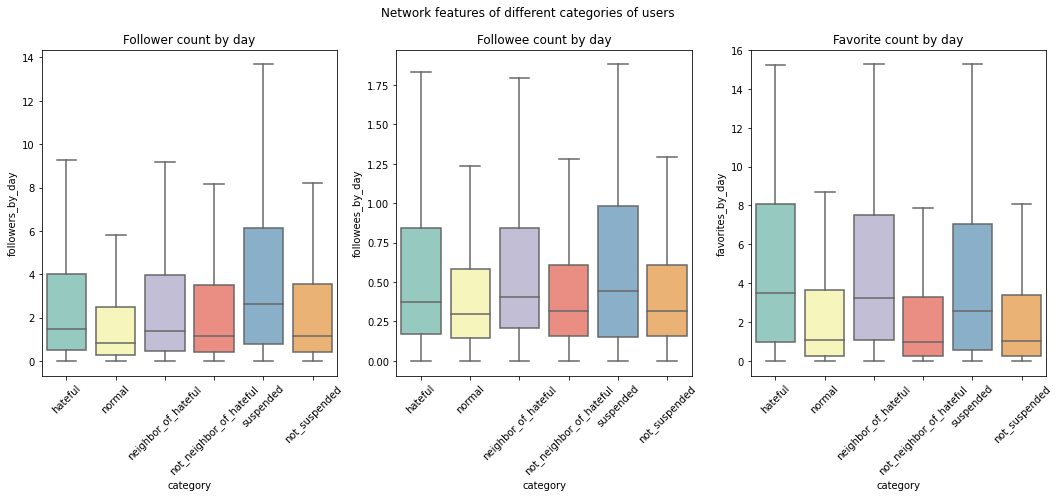
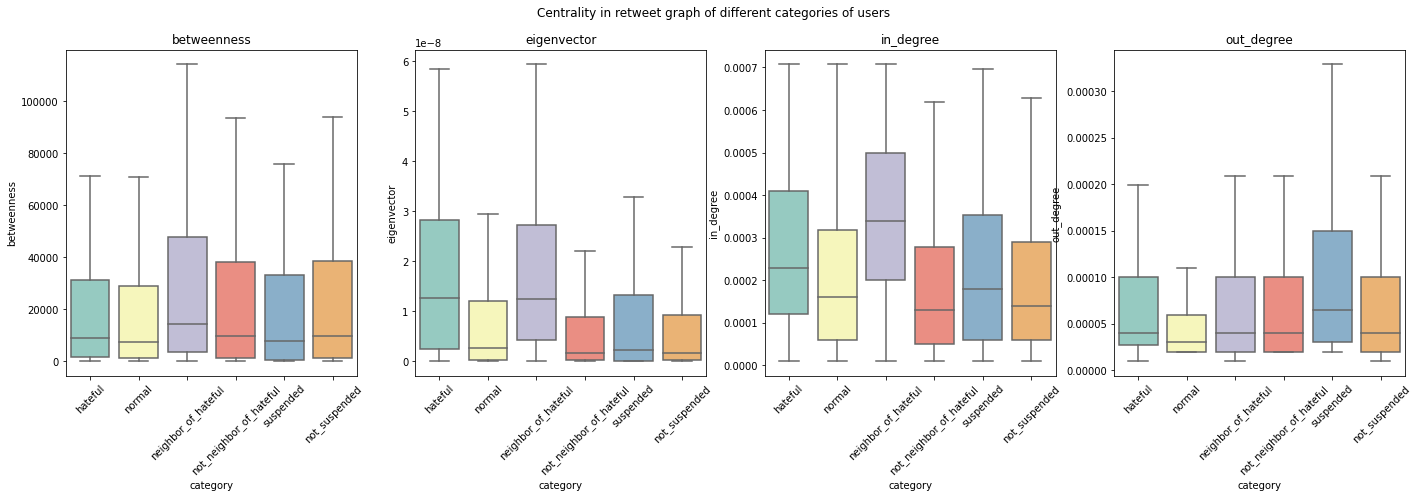
More powerful and central in the network:
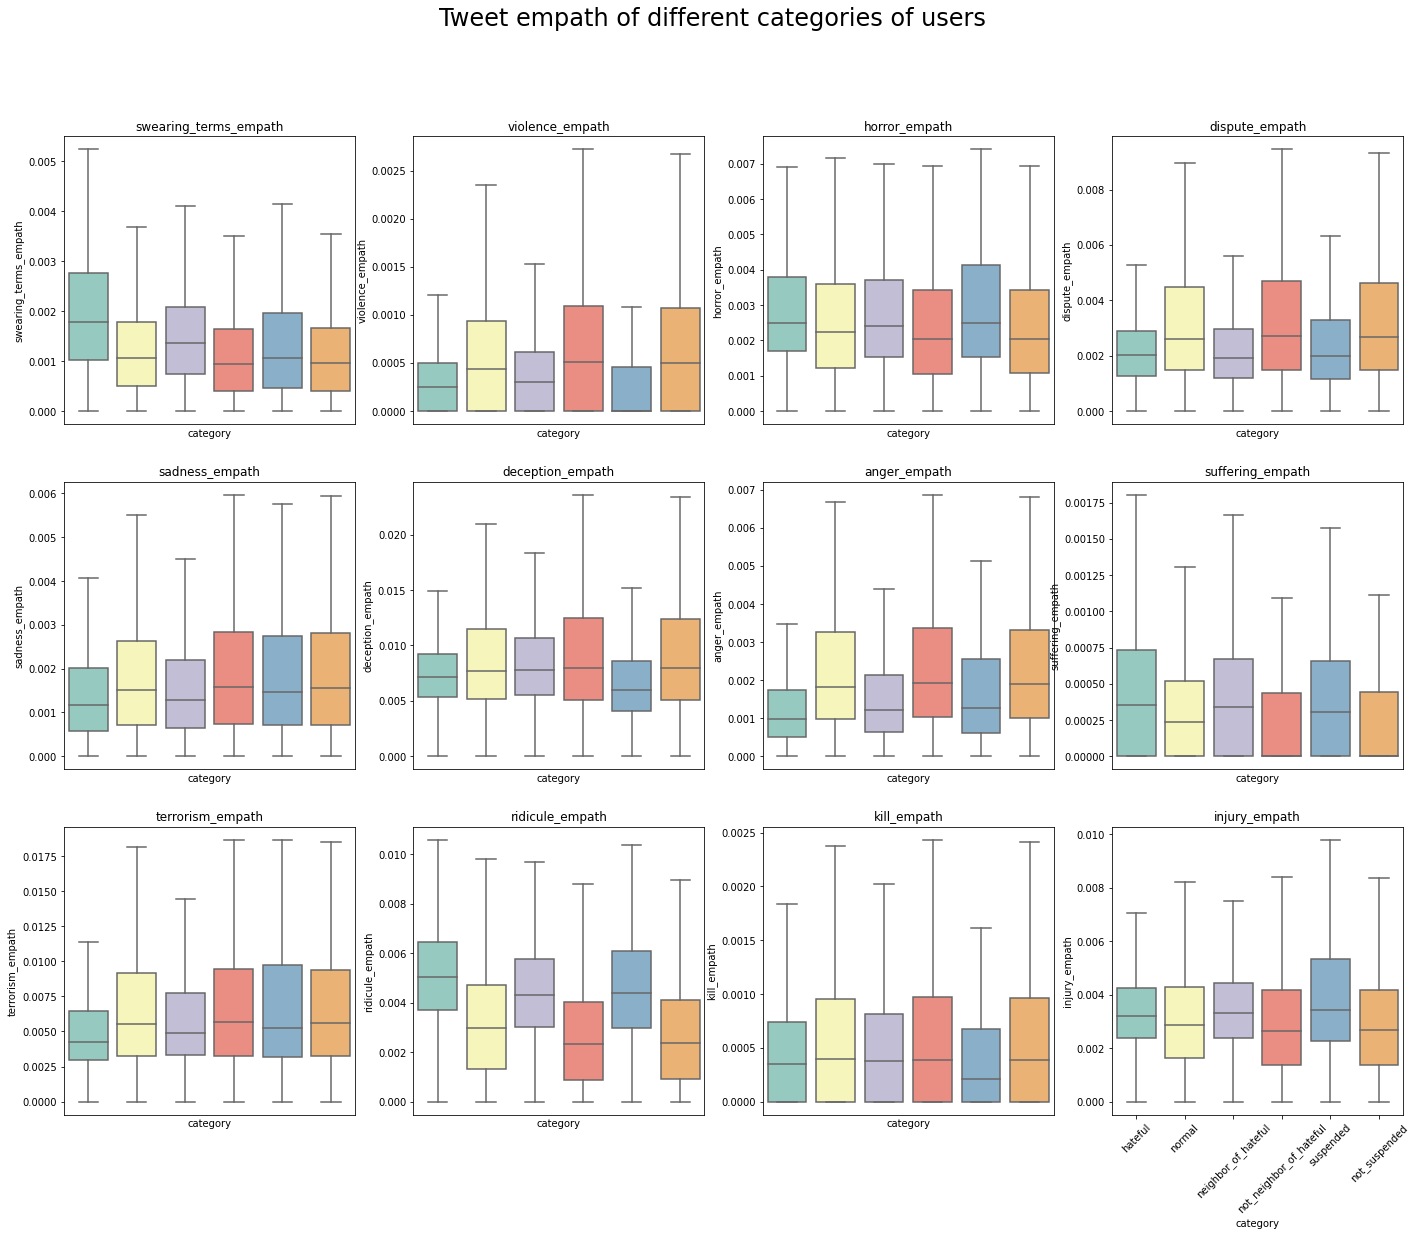
Focuses more on tweeting negative contents:
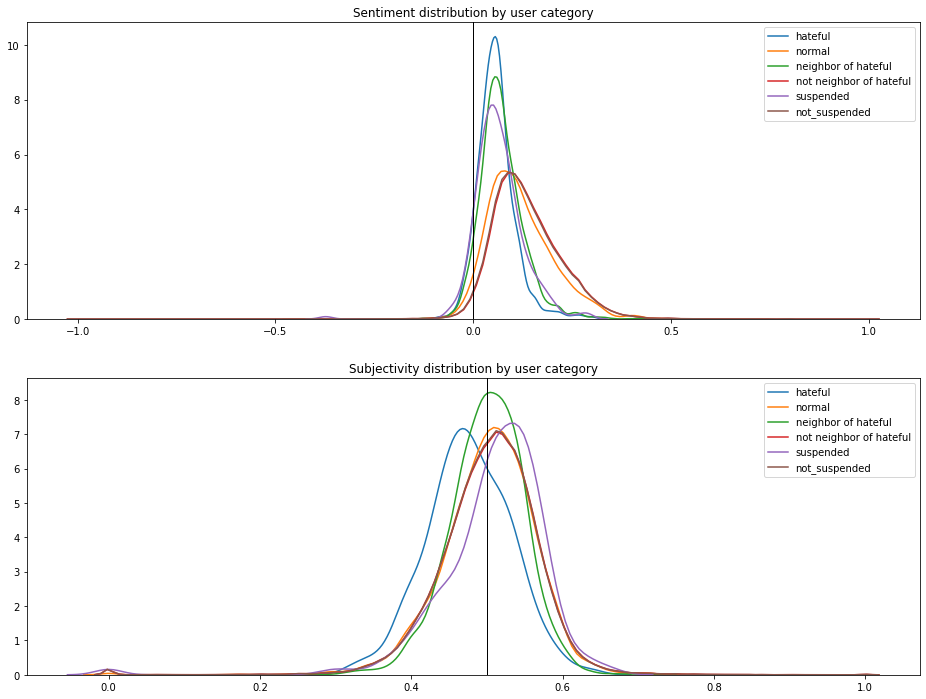
One might also conjecture different tweet empath features between hateful and normal users, but this is harder to tell immediately given the high dimension of empath. In further analysis, an empath-focused dimension reduction analysis could be helpful.
Predictive Modeling
Data preprocessing
In the dataset, about 5% of the users are annotated as ‘hateful’ or ‘normal’. I trained my models on these users (n=4971).
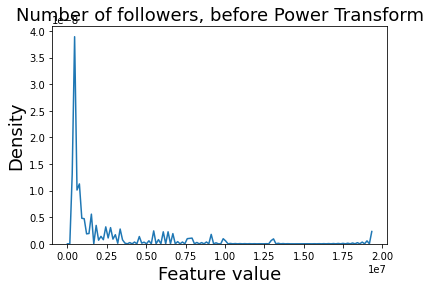
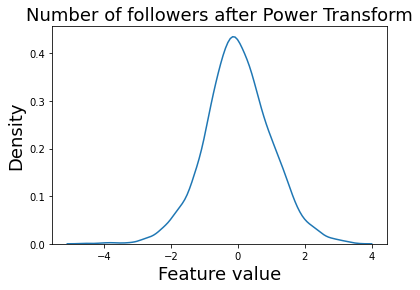
I dropped the columns that are mostly null values. Since the numerical variables have long tails, I appled power transformation to map those to Gaussian distribution. For example:
We have an unimbalabced dataset here. Among the 4971 users, 544 are ‘hateful’ and 4427 are ‘normal’. Therefore, I calculated the class weights to feed into model training. It turns out that each ‘hateful’ label has a weight of 4.57 and each ‘normal’ has a weight of 0.56.
For the train/test data split, I used 0.7/0.3 for the first two models. For the GCN models, given its properties and referenced best practice, I used 0.15/0.85 split. Therefore, the GCN models will require much fewer training samples than the other methods.
Logistic regression: build a model on features
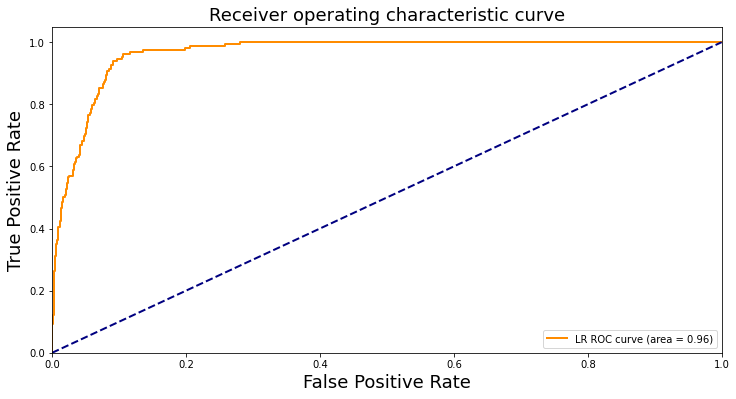
I first built a logistic regression model on manually engineered features that cover information of the users, their tweets, and their characteristics in the network. It achieves a pretty high testing accuracy of 0.928, and a high AUC value of 0.965. The precision is 0.715 and the recall is 0.571, yielding a F1 score of 0.635. Therefore, although it achieves an overall good performance, it tends to predict less positive values and is less effective in recalling the hateful cases. The ROC curve of the model is shown below:
Neural network: build a model directly on tweet embedding
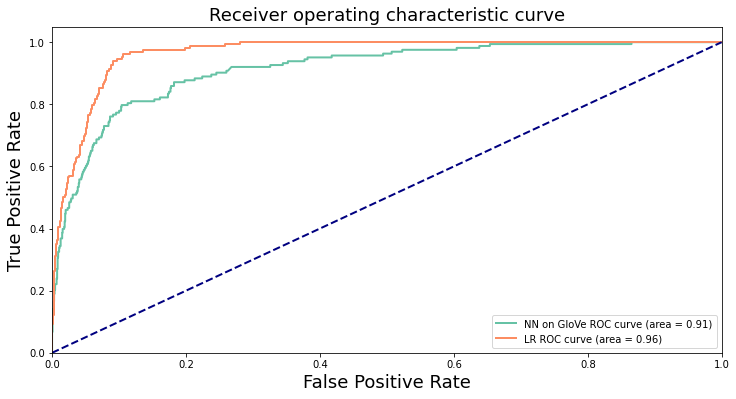
The second attempt was to directly learn an end-to-end model using the GloVe embedding, which I purposely left out in the logistic regression model. I employed a simple neural network, shown as below. It achieves a testing accuracy of 0.850 and an AUC of 0.913. The precision is 0.406; the recall is 0.810, and the F1 score is 0.541. Compared to the logistic regression model, the NN model has a notably lower precision but higher recall. In other words, it recalls more hateful users at the expense of mistaking normal users for hateful ones. The ROC curves of the first two models are shown below:
Graph deep learning: build models on features and the network graph
Making use of the newly established Graph Convolutional Network models, I further built three models: GraphSAGE, GCN, and GAT. These models directly learn from the network graph as well as the node (user) features. Unlike the logistic regression training, I didn’t feed hand-crafted graph features to these models. I also decrease the user and tweet features in these models, to test their capabilities to learn directly from the graph.
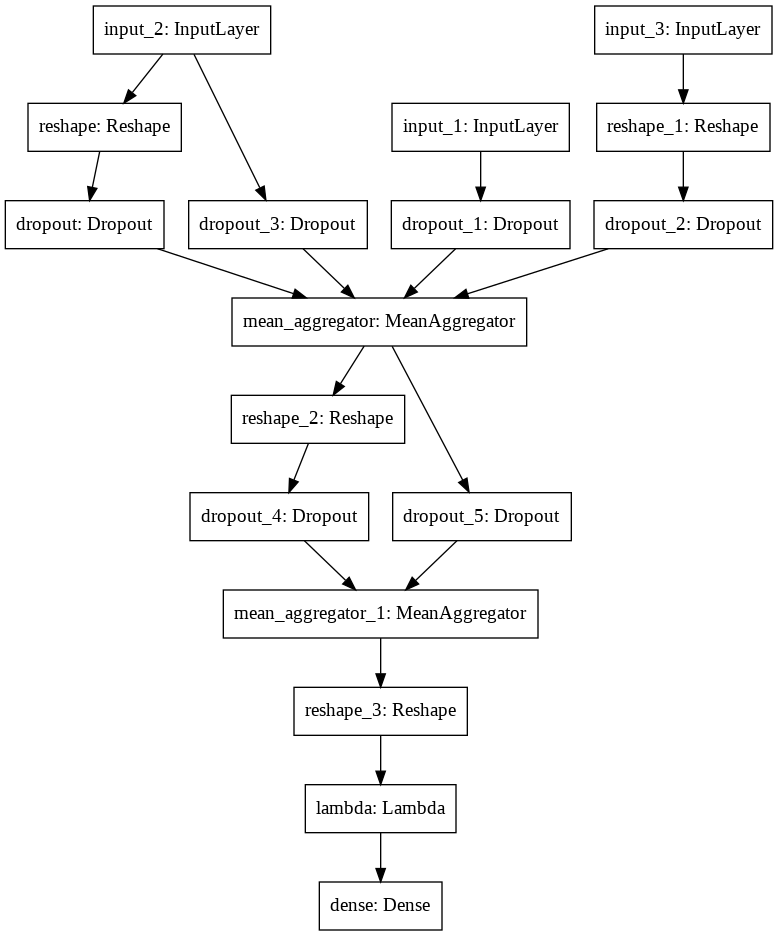
The GraphSAGE model, which is the state-of-the-art model, performs the best. The model structure is shown below. It achieves a testing accuracy of 0.855, AUC of 0.936, precision of 0.419, recall of 0.897, and F1 of 0.571. The high recall of the model stands out, which is a key metric for imbalanced-data scenarios.
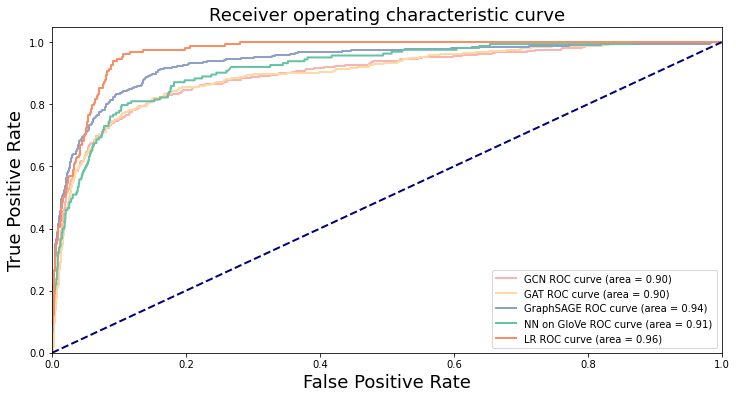
The GCN achives an accuracy of 0.923, an AUC of 0.897, a precision of 0.660, a recall of 0.587, and a F1 score of 0.621. It seems to reside in the middle ground of GraphSAGE and the logistic regression in terms of the recall- precision tradeoff.
The GAT reports an accuracy of 0.870, an AUC of 0.896, a precision of 0.440, a recall of 0.780, and a F1 score of 0.563. Its performance and advantages are closer to the GraphSAGE model. The ROC curves of all the models are shown below:
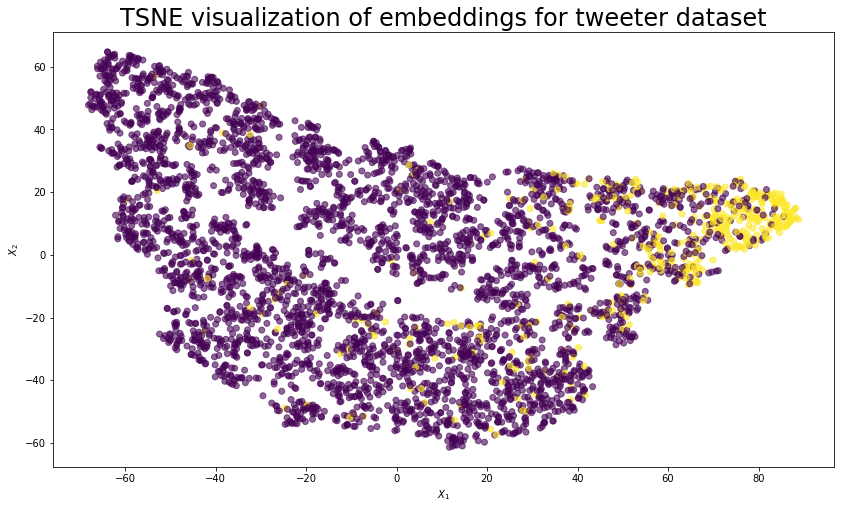
Can GraphSAGE Embedding Differentiate hateful from normal?
I took an extra step to analyze the embedding of the GraphSAGE model. I applied TSNE to dimension reduction and cluster visualizetion. It is clear that many hateful users are clustered on one end, although some are scattered among the normal users.
Summary
The logistic regression model and GraphSAGE have the most satisfying overall performance. However, the graph models are impressively better at recalling hateful users, although at the expense of mistaking normal users for hateful ones. For imbalanced data, recall could be more important than precision.
Reference
Referenced Github resources:
https://github.com/manoelhortaribeiro/HatefulUsersTwitter/tree/master/analysis
https://github.com/manoelhortaribeiro/GraphSageHatefulUsers
https://github.com/stellargraph/stellargraph/blob/develop/demos/use-cases/hateful-twitters.ipynb
Other referenced resources: http://snap.stanford.edu/graphsage/